

Lower Midwest flatbed rates are up, but a higher loaded-mile number does not automatically mean higher take-home pay. This driver-focused September 2026 briefing shows where the strongest published outbound rates are, which freight categories have better signals, and how to test a load after deadhead, fuel and operating costs.
Rate snapshot: week ending September 4, 2026. Market information reviewed September 14, 2026.
First, read the rate correctly
DAT reports spot linehaul paid to carriers, excluding fuel. It is a market benchmark—not a guaranteed rate for your truck, and not your net pay. A quote can change with trailer type, dimensions, tarping, permits, loading time, destination and the number of empty miles.
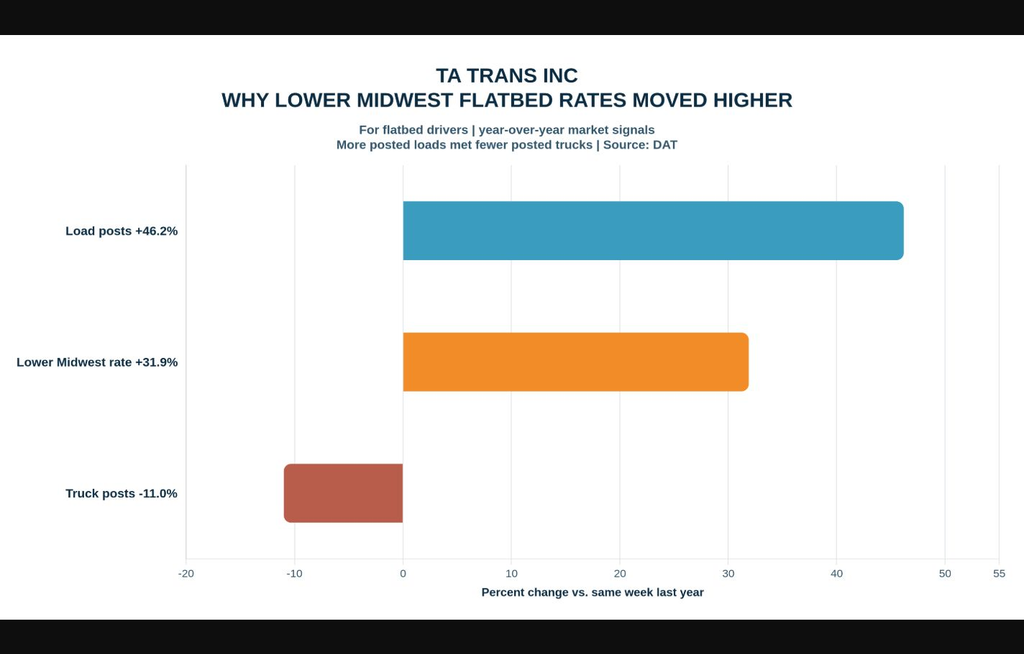
For the week ending September 4, national flatbed spot linehaul averaged $2.66 per loaded mile, up 31.2% from the same period last year. Lower Midwest outbound averaged $2.69 per loaded mile, up 31.9% year over year and 4.2% week over week. See the DAT flatbed report for the full methodology.
| Origin region | Outbound linehaul | Year over year |
|---|---|---|
| Ohio River | $3.28/mile | +44.2% |
| Southeast | $3.25/mile | +42.4% |
| Great Lakes | $2.93/mile | +40.1% |
| Lower Midwest | $2.69/mile | +31.9% |
| National flatbed | $2.66/mile | +31.2% |
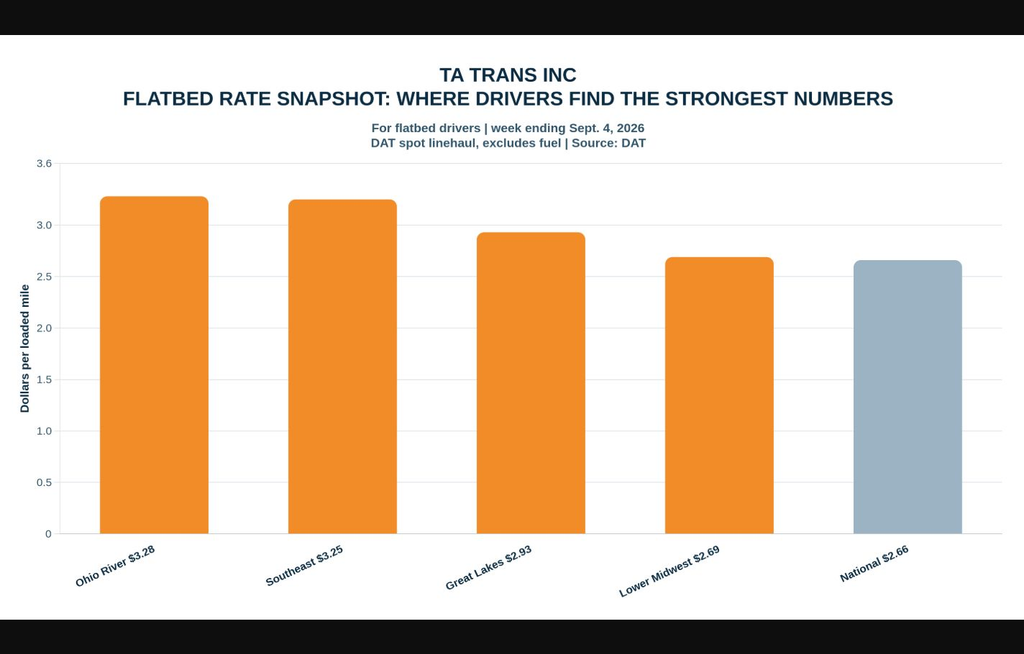
These regions are not interchangeable lanes. A strong origin average can still produce a weak trip if the destination has poor reloads, the pickup requires hours of securement, or the shipment needs specialized equipment.
What changed in the Lower Midwest?
DAT records the Lower Midwest increase, but does not identify one cause. National load postings were 46.2% higher than a year earlier while truck postings were 11% lower. Those are load-board measures, not a count of every shipment or truck. They point to a tighter posted market, but they cannot prove that steel, harvest or data-center freight caused this specific regional move.
For a driver, the practical explanation is lane-level: how many trucks can cover the pickup, whether the destination has a reload, how much securement the freight takes, and whether a step deck or stretch trailer is required. Compare the complete trip before accepting it.
Freight worth watching
Project and industrial freight: ACT Research says data-center construction, related power generation, infrastructure, utility work and machinery are supporting flatbed demand. These loads can reward specialized equipment and experience, but they may also involve appointments, permits, waiting and detailed securement. Read ACT’s August flatbed update.
Steel and construction materials: Structural steel, utility components and building materials remain natural open-deck freight. Look for a clear loading plan, realistic tarping time and a destination with a credible next load. “Steel” alone is not proof of a profitable lane.
Agricultural machinery: AEM reports that U.S. tractor sales fell 8% in August 2026 and combine sales fell 4% year over year. That is an equipment-sales signal, not a truckload count. Dealer transfers and used equipment can still move, but treat new-machinery demand as a softer signal and verify the actual lane.
The profit test: loaded miles are not all miles
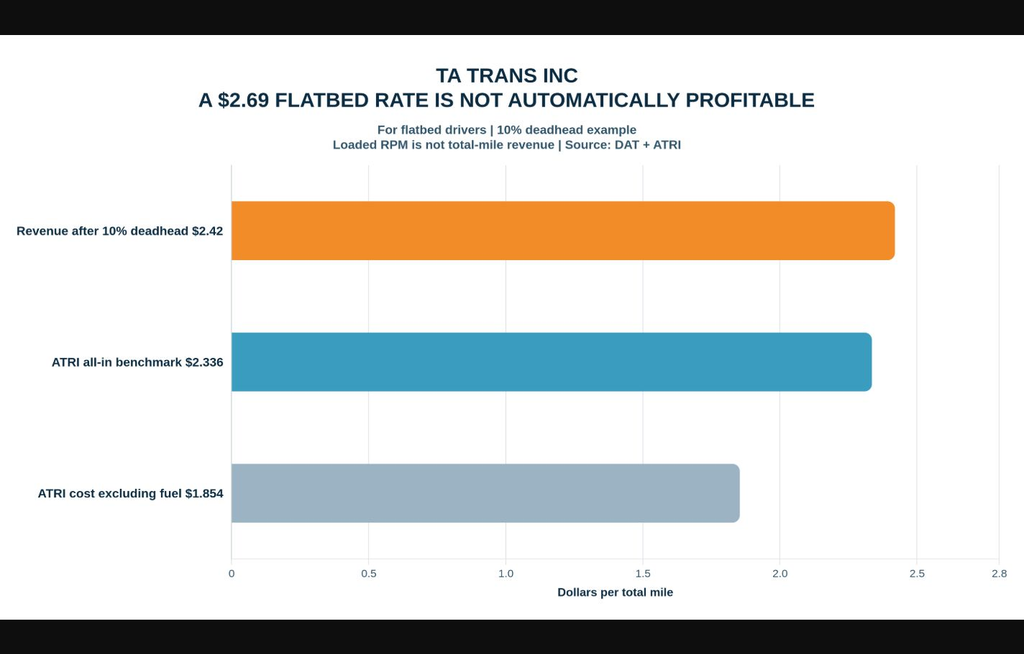
ATRI’s 2026 operational-cost update puts the 2025 industry-average cost of operating a truck at $2.336 per mile. That benchmark includes operating costs across the industry; your own cost may be higher or lower. It is a useful warning against calling the DAT linehaul rate “profit.” See ATRI’s cost report.
Here is an illustration using the Lower Midwest average. It is not a quote or a promise:
| Illustration | Loaded revenue per total mile | Less $2.336 cost benchmark |
|---|---|---|
| $2.69 loaded RPM, 10% deadhead | $2.42 | about $0.09/mile before taxes and owner pay |
| $2.69 loaded RPM, 15% deadhead | $2.29 | below the benchmark |
The formula is simple: loaded rate × loaded miles ÷ all miles. Then subtract your actual cost per total mile. If fuel is paid separately, apply the fuel-surcharge terms correctly; if it is included, do not count it twice. Our fuel-surcharge guide explains the index, base price, MPG and eligible miles to check.
Where the better opportunity may be
The highest published origin averages in this snapshot are the Ohio River and Southeast. Great Lakes is also above the national average. That does not make them universally “best.” A better opportunity is a trip with:
- a rate that covers all dispatched miles;
- a short or paid loading and securement process;
- a destination where you can reload without a long empty move;
- equipment and permits you already understand; and
- enough time to protect hours-of-service and maintenance time.
Before accepting an attractive outbound number, ask for the exact pickup and delivery ZIP codes, loaded miles, expected empty miles, weight and dimensions, tarp or chain requirements, detention terms, fuel treatment and the likely next-load market.
Flatbed, step deck or stretch?
Use the equipment that fits the freight and your operating plan. TA Trans’ flatbed service covers open-deck cargo such as steel and industrial materials. A step deck can help with height-sensitive machinery. An extendable flatbed can suit long freight, but permits, route planning and securement can change the economics.
Our earlier flatbed rate breakdown and summer peak-season update explain earlier points in the 2026 cycle. Their figures are historical context, not a replacement for today’s lane math.
Flatbed rate FAQs for drivers
Which regions show the strongest flatbed rates in this snapshot?
The highest published outbound averages are the Ohio River at $3.28 per mile, the Southeast at $3.25, and the Great Lakes at $2.93. Lower Midwest averaged $2.69. These are DAT linehaul benchmarks excluding fuel, not guaranteed rates or net pay.
What freight should flatbed drivers watch?
Project and industrial freight—such as machinery, utility components, structural steel and freight tied to data-center or power projects—has a supportive demand signal. Agricultural equipment is a softer signal because August U.S. tractor and combine sales declined year over year. Verify the actual lane, loading time and reload before choosing a commodity.
Is a $2.69 flatbed rate profitable?
Not automatically. With 10% deadhead, $2.69 per loaded mile works out to about $2.42 per total mile before costs. Against ATRI’s $2.336 industry-average operating-cost benchmark, that leaves about $0.09 per total mile before taxes and owner pay. At 15% deadhead, the revenue is about $2.29 per total mile, below that benchmark. Your own cost may be different.
What should I ask before accepting a load?
Ask for exact pickup and delivery ZIP codes, loaded and empty miles, weight and dimensions, securement and tarp requirements, detention terms, fuel treatment, permits, appointment times and the likely reload market. Evaluate the complete trip, not just the loaded RPM.
Are these rates the same for step deck and stretch flatbed work?
No. A national or regional flatbed benchmark does not price a particular step deck or extendable trailer. Equipment availability, permits, route requirements, securement, loading time and specialized experience can change the economics. Confirm the actual equipment and terms before dispatch.
Bottom line for drivers
Flatbed rates are stronger than last year, but the market is uneven. Project freight, utilities, machinery and construction can create good opportunities, while agricultural-equipment demand is softer. The winning load is not necessarily the one with the biggest loaded RPM. It is the one that leaves a positive result after all miles, fuel, time, equipment and the next reload are included.
Have a load or lane you want to evaluate? Bring the origin, destination, dimensions, weight and timing to the conversation. TA Trans operates flatbed, step deck and stretch flatbed equipment and can discuss the shipment requirements with you.
Benchmarks are informational. ATRI’s cost figure is an industry average, not an individual driver’s cost. DAT’s figures are linehaul-only and exclude fuel.